With Clarity Comes Focus: How to Reduce SRE Team’s Cognitive Load

With the success of the Google SRE book, more and more teams are transitioning from a traditional sysadmin/”ops team” model for managing production incidents towards the SRE ideal - an empowered, engineering-focused team that spends at least 50% of their time on creative work that helps teams move towards more automated and sustainable infrastructure. But cutting down to half of the current time your team spends fire-fighting and doing other traditional “ops” tasks isn’t easy - it requires bold long-term vision, strategic planning, and the right tools for your team. 

With this challenge in mind, a natural inclination for SRE leaders is to go searching for data - how rough is the situation right now? Where do their teams measure up in terms of some common SRE KPIs, like mean time to understand (MTTU) and mean time to respond (MTTR) to incidents? How frequently are their team members woken up at night with an ops problem?

Luckily, this information is probably recorded in teams’ existing incident management platforms  - but busy SRE teams don’t have a ton of time to comb through it. This is why many AIOps and incident management tools have introduced complex analytics features, happily churning out histograms and pie charts for curious team members to peruse.

Although data visualization is important, in production systems with lots of noisy alerts, it may not be as helpful as we’d hope: Underlying issues can hide in “good” data.

Let’s use mean time to acknowledge as an example. A decrease in MTTA, which is easily determined from the per-incident statistics from your platform, could look like improvement for an SRE team. But maybe the reason for this drop is that some of your systems have started producing some flapping alerts, leading the team to just ack as soon as they’re paged - the SRE equivalent of subconsciously hitting the snooze button or mass-deleting emails. In order to find this truth, you’ll have to dig deeper into the data or talk to a team member.

It’s hard to maintain a single source of truth

Most modern production systems include a bevy of tools that all have their own definitions of “incidents” or “alerts,” making it tricky to understand analytics that that include data points across multiple sources. For example, let’s look at a simple metric - the number of incidents a team sees per week. Does this include:

  • Every alert that triggers in a monitoring system?

  • Every incident a team member is paged for?

  • Repeats of the same alert/incident?

  • Alerts that resurface after a snooze period?

  • Multiple incidents that occur at the same time for one underlying issue?

  • Only incidents that actually require human action?

Chances are, analytics for the “number of incidents” are going to mean different things in each tool, and any one of those numbers may or may not be the most meaningful choice for a team.

Your team has the most valuable perspective

One of the foundational principles of Kaizen, the Japanese principle of continuous improvement, is that team members at all levels should be involved in the evolution of process. This is because even with the fanciest analytics platform in the world, the people doing day-to-day work still have the greatest insight into the hangups and struggles of the process. Using incident analytics to establish a baseline is a great idea, but the more nuanced steps toward SRE greatness don’t require fancier graphs - they just require talking to the team. 

A clearer picture

Built-in tools to help you visualize your data can be useful, but in a noisy production environment, an overload of graphs and charts will actually make life harder. An underlying reason for the potential issues with an analytics-first approach to SRE process improvement is that most production systems still have lots of noisy alerts.

Instead of looking for new ways to visualize the noise, what if there was a way to create greater clarity at the alert level first?

Through layers of machine learning-driven filters and correlation logic, SignifAI helps consolidate and streamline incidents across all of your platforms so your team only gets paged for what matters.

With this clarity and context, you’ll be able to answer questions about your team’s progress and production environment health much more quickly, and spend less time pushing through the noise.

DevOps Tools - Something is Still Wrong...

Although companies have invested heavily in automating specific portions of their DevOps pipeline in the last 10 years, everything from build and test, log management, performance monitoring and incident management, the common refrain we hear is that despite being able to ship more code, faster and with fewer defects, their system and application availability has not moved dramatically in a positive direction. Why is that?

More often than not, this is because the engineers that are more “Ops” than “Dev” in an organization (those actually responsible for running code in production) are constantly “fighting fires.”

Why are teams “fighting fires” vs working on tasks that could dramatically improve uptime? They are hampered by the inefficiencies introduced by the very DevOps tools which are supposed to help them. A lack of integration, visibility and correlation between the tools forces engineers to waste time on tasks that could be automated but lack the tools to make it so.

More specifically, here are a few examples in a typical incident management workflow where there exists plenty of opportunities to automate…

  • Dealing with “alert noise”.

  • Searching for and correlating the relevant logs, events and metrics in order to create impactful solutions based on informed root cause analysis.

  • Searching for known solutions you know are applicable to the current issue but just can’t locate them efficiently.

  • Analyzing data, patterns and behaviors to understand what sort of preventive fixes could be implemented today that would dramatically improve uptime tomorrow.

Alert noise

First, “what is alert noise?” Alert noise is that thing you experience when you see your Slack channel or phone clogged with informational, test, duplicate, unprioritized and irrelevant alerts.

To easily understand how “alert noise” affects system and application availability answer this simple question:

What percentage of the alerts do you receive on a daily basis that you end up immediately dismissing or spend some time debating whether or not to ignore?

Now, do the math. If an SRE on staff spends even 20 mins a day acknowledging, prioritizing, researching and ultimately dismissing alerts, that’s at least 87 hours a year wasted. Multiply that by the number of SREs on staff and ask yourself, “What could an engineer be working on during those 87 hours if it wasn’t spent ignoring or dismissing alerts?” The answer is likely, “Working on the things we know will dramatically improve our uptime, but we simply don’t have the time to work on because we are constantly fighting fires.”

What can be done to reduce alert noise?

One option, which a few incident management tools recommend, is to manually analyze your alert history and then create and maintain an exhaustive rules engine. This is definitely not a “set it and forget it” solution. Instead one that requires constant tweaks to account for changes to your environment in order to consistently reduce alert noise.

Another option is to leverage some sort of an AIOps platform that makes use of machine learning and AI to analyze your alerts historically and in real-time to automatically correlate, roll-up and prioritize your alerts and events. Because the algorithms employed constantly adapt to changes in your incident workflow, there’s no need to constantly be tuning a rules engine.

At the end of the day, your team is already attempting to reduce alert noise in one way or another, so why not let a machine do it more efficiently and more accurately so you can focus on more important issues?

The problem with root cause analysis

The next area ripe for automation in the incident management workflow is going to be optimizing the time spent searching for and correlating all the relevant logs, events and metrics that pertain to an alert. This process is vital for conducting informed root cause analysis. Why? Because ideally you want to put into production impactful and permanent solutions vs temporary fixes. To do this requires getting full context and as much visibility as possible into all the relevant data that pertains to the alert. Engineers are generally not satisfied with “bounce the server and hope the problem goes away” type of solutions and would rather invest the time to do proper root cause analysis.

However, when you are busy fighting fires, the luxury of performing detailed root cause analysis isn’t always possible. As tempting as it is to just restart a service or redeploy a container with additional resources, what if you could easily determine that the true cause of an issue was a misconfiguration in Ansible or poor test coverage in Jenkins? These types of solutions reach back further into the DevOps toolchain to address problems that will sooner or later manifest themselves again.

AIOps platforms makes it easy to get all the relevant data (whether it be logs, events or metrics) inside the alert itself so you don’t have to context switch between tools, download files and cut and paste data into spreadsheets or a doc for analysis. 

So far we’ve managed to save time by reducing alert noise and automating the process of getting all the relevant data into the alert itself, what’s next? How about saving time the time spent searching for solutions you know you’ve implemented in the past that could be used to solve the alert you are actively triaging?

Avoiding “reinventing the wheel”

One of the things all engineers are stereotypically bad about is documentation. SREs are no different when it comes to documenting solutions they’ve deployed. Even if the solutions are documented they are often in a format that doesn’t lend themselves to being easily indexed, searched and surfaced for reuse at a later date.

Ask yourself:

“How often have I wasted time hunting down solutions I know exist but our ‘hidden’ in a Slack conversation, email thread, Wiki, runbook or worse someone else’s head?”

Here is an example where SignifAI makes it easy to document solutions using a wizard driven knowledge base creation system.

uptime-3-610x372.png

SignifAI automatically correlates solutions from the past or industry best practices with alerts happening in real-time and surfaces them with a probability score.

uptime-5-610x786.png

Machine learning is only going to be as good as the data set it has to work with (think logs, events and metrics vs just metrics) and how much supervised learning can be applied to the recommendations that the algorithms produce. SignifAI has made it easy for users to vote up or down and provide feedback to any solutions it recommends. Ultimately, this means that the more you interact with the recommendation engine, the greater the accuracy of recommended solutions in the future. More accuracy means less time spent looking for solutions you know exist.

Become proactive vs reactive in your approach to uptime

So, at this point if you’ve succeeded in reducing alert noise, the time spent gathering data and hunting down fixes…what are you going to do with all this extra time you’ve now gained?

“If we had the time to rearchitect our application, 80% of our problems would go away.”

“If we had the time to break up our monolithic service into microservices, we could minimize the impact of problems when they occur.”

When engineers are given additional time in their day, they will inevitably want to work on creative and interesting problems that have a far greater chance of actually improving uptime then the status quo of “fighting fires” ever will.

I believe that AI and machine learning are the perfect technologies to help automate tasks your team takes no pleasure in doing and at the end of the day, is not a good use of their time.

Anomaly Detection for SREs and DevOps

I’m going to cover anomaly detection by answering the question, “What are the anomaly detection concepts an SRE and DevOps engineer should know in order to help them ensure more uptime and perform root cause analysis more efficiently?”

What is anomaly detection?

Anomaly detection, sometimes referred to as “outlier detection,” is the process by which machines attempt to identify outliers that deviate from a “normal” or expected pattern of behavior.

Labeled vs unlabeled data, what’s the difference?

Before we get into the different types of anomaly detection, it helps to make sure we understand the difference between labeled and unlabeled data. Why? Because data is what trains machines to detect and make judgements about what constitutes an anomaly. Here’s a simple example to illustrate the difference:

An unlabeled inventory of assets might just tell us if a system is a “physical server”, “VM”, or “container.” A labeled data set would include more useful information like “location,” “OS,” “CPU,” “RAM,” “package version,” “build number,” etc. From a machine learning perspective, the more labels or tags a piece of data has, the more likely it will be able to produce an accurate insight about unlabeled data it is asked to evaluate. Put another way, the denser and relevant the data set, the better the training and resulting correlations.

What are the different types of anomaly detection?

Generally speaking there are three types of anomaly detection methods worth understanding…

Unsupervised anomaly detection

anomaly-supervised-610x554.png

In this method of anomaly detection you are dealing with unlabeled data. You are basically asking the machine to decide what doesn’t look “normal” by finding patterns or clusters within the data. For example: We might give the machine a dataset of half a million points that measured the CPU utilization of a system every minute for a year. The machine will point out which data points might be outliers and which look “normal,” but it’ll be up to a human to make the final judgement as to whether or not they are actually outliers. For example, maybe high CPU utilization was expected at certain times because of seasonal load and that particular pattern should be classified as “normal.”

At SignifAI, we are combining different approaches. First, we are using multiple outlier algorithms which helps us detect a variety of anomaly conditions. DBSCANHampel FilterHolt-Winters and ARIMA (X, SA) to name a few. Those are being used mostly on metric data, but also help us in smooth hard streams before pushing them into the next anomaly tier. Other types of methods SignifAI uses are mostly based on Supported Vectors Machines (or SVM) type algorithms, as well as Bayesian and Probabilistic modeling.

Bayesian modeling is a way of calculating the likelihood of some observation, given the data you’ve already seen. It allows you to declare your statistical beliefs about what your data should look like before you look at the data. These beliefs are known as ‘priors’. You can declare one for each of the parameters you’re interested in estimating. Bayesian modeling looks at these priors and the observed data, and calculates a distribution for each of those parameters. These are known as ‘posterior distributions’. Part of the benefit of probabilistic programming, relative to comparable Bayesian modeling in the past, is that you don’t need to know anything about how that calculation happens. There are many advantages in working with these models but for us the most important one is that we get a way to encode the expert knowledge about the data into the model and provide context. This is very important for an SRE because as an expert you can know that there is no chance at all of certain observations. The other statistical advantage is that there are no limitations on which distributions can be used to model the use case.

Supervised anomaly detection

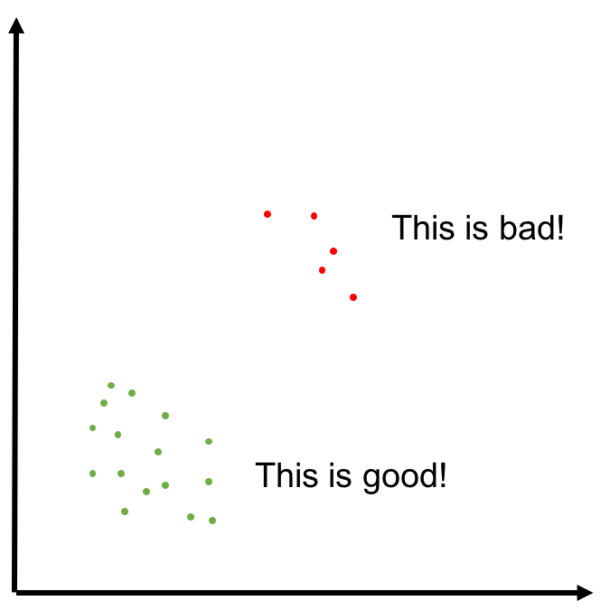
In this type of anomaly detection you train the machine to spot anomalies by feeding it two sets of data. The first set of data tells the machine what sort of behavior is “good.” The second data set tells the machine what sort of behavior should be considered “bad.” If we revisit the previous example, with supervised anomaly detection, the machine has clear instructions on how determine what an outlier is. For example, the labeled data set might include the acceptable utilization percentages at any given minute during the year to account for seasonal load.

At SignifAI, we wanted our machine intelligence platform to be able and work right out-of-the-box with minimal training and user interaction. The reason for this was that although the benefits are huge, the typical on-call SRE is going to lack AI expertise and not have the time to create large training datasets to train the monitoring system.

When an expert SRE on-call detects an anomaly, the last thing they want to be dealing with is drilling into graphs and/or events and label them for future training data. The alternative would be to review and label very large, historical datasets. However, this also requires a lot of effort and time. Because of that – at SignifAI have chosen not to use supervised learning as a technique for real-time technical operations use cases. Where we have found it very relevant, is in allowing the user to provide feedback to correct an automatic detection after-the-fact. Based on that user feedback, SignifAI adapts (or more specifically “trains”) on how it can more accurately handle future detections.

Semi-supervised anomaly detection

In this final method for detecting anomalies, a model of what should be considered “normal” is generated from a dataset and then evaluated against another dataset to see what the likely outliers would be. It’s considered “semi-supervised” because the dataset that is used to supervise the comparison can be thought of as an assumption of what might constitute as “bad,” but still requires some degree of human validation.

How is anomaly detection useful to DevOps and SREs?

Monitoring “unknown unknowns”

Anomaly detection is great at uncovering unknown issues lurking within your systems that might threaten system availability. It is often the case that there is plenty of monitoring data being collected, but it just isn’t being analyzed effectively. And more importantly, correlated against other data sets which aren’t compatible to detect “abnormal” behavior.

Alert noise

Sometimes referred to as “alert fatigue,” alert noise is something almost all organizations deal with when they employ a variety of tools to monitor thousands of metrics and events. Ask any SRE who has ever been on call to tell you how frustrating it is to deal with alerts that weren’t worth acknowledging (false positives) and critical alerts that got overlooked (true positives) because they got lost in the “noise.” Anomaly detection, when applied to alerts can help aggregate them into “incidents” or higher order alerts so you end up with less alert volume. And those that you do get, will likely be alerts you need to react to.

Detecting anomalies in logs

If you are using tools like SplunkElastic or SumoLogic to manage and monitor your logs, anomaly detection can be useful in helping reduce log lines into higher order categories or groups to enable the recognition of any patterns that might signal problems. Training data sets can involve a historical scanning of previous logs, as well as in a supervised fashion, by labeling specific log lines as outliers or predictors of “bad things to come.”

Detecting anomalies in metrics

Applying anomaly detection to time-series data is a classic use case. A few APM and infrastructure monitoring vendors like Datadog and New Relic have recently introduced this feature into their services. Depending on the metric and use case, teams may want to evaluate if a datapoint is an anomaly based on:

  • Recency: Is this an anomaly compared to the last 5 minutes of data I have?

  • Historically: Is this an anomaly compared to the data I have collected since the system first came online?

  • Seasonality: Is this normal for a specific time of the day or year? (For example: Black Friday.)

  • Correlated: Is this anomaly conditionally ok because of the value of another metric or variable? (For example: A build process running on the machine.)

Anomaly detection as it applies to metrics is definitely not a one size fits all proposition and teams should choose their algorithms accordingly.

Detecting anomalies across data types

So far we have covered different solutions that support some degree of anomaly detection. However, a more interesting question to ask now is:

Is it possible to detect an anomaly output from Splunk and combine it with an anomaly output from Datadog?

With SignifAI there are couple of ways to detect multiple anomalies and the relationships between them. First, it is important to remember that the SignifAI platform is completely vendor and tool agnostic. This means SignifAI can take the anomalies detected in your log, metrics or events monitoring tools and correlate between the multiple anomalies just like another stream of data. What if you want to determine causation? What can be said about one anomaly affecting another anomaly? Or even better, determining if it is the root-cause of the other anomaly? Well, because SignifAI is using Bayesian structural time-series models, it is possible to try and predict the counterfactual, i.e., how one specific anomaly stream would have evolved after the other anomaly stream if the second anomaly stream had never occurred.

Should you build your own anomaly detection system or use your monitoring tools?

Despite the mathematics having been around for a long time, it was only until recently that APM, log and infrastructure monitoring vendors began to incorporate anomaly detection functionality into their tools. The majority of the implementations so far have been rather basic. The other limitation of course is that they are siloed. They can only detect anomalies within the data sets they can consume, for example logs or metrics. If we recall, the more relevant training data a machine has at its disposal, the more powerful the correlations and the greater the accuracy of anomalies it can detect.

Aside from these tools limiting their anomaly detection to their respective data domains, you should also consider the development and maintenance costs associated with building your own system. In-house expertise is also required to develop a robust anomaly detection system that can yield accurate and actionable results. It’s often better to buy a subscription to a service if you don’t have the in-house expertise, budget or highly specialized use case that merits going at it alone.